Analytics That Tell You What to Do Next.
OAN Operational Analytics goes beyond dashboards. Pre-built KPIs across every OAN product give you real-time visibility, while AI surfaces anomalies, recommends actions, and answers questions in plain language. Your data tells the story. AI tells you what to do about it.
Most Finance Teams Have Reports. Few Have Answers.
Traditional BI tools show you what happened. They require analysts to build queries, maintain data pipelines, and interpret results. By the time the report is ready, the window to act has often closed. OAN flips this: analytics are embedded in the operational flow, AI surfaces what matters, and recommendations arrive alongside the data.
Reports without context
A dashboard shows DSO is up. But which customers? Which invoices? What changed? Without drill-down to the transaction, a metric is just a number.
Insights buried in data
The pattern is in your data, but finding it requires a query you did not know to write. AI should surface the anomaly before you go looking for it.
Separate tools, stale data
Exporting to Excel or a BI tool introduces lag, version confusion, and maintenance overhead. Analytics should live where the transactions live.
AI That Works Alongside Your Team.
Built on Oracle Database 26ai and OCI Generative AI, the insight engine analyzes transaction patterns across your entire OAN environment. It detects anomalies, generates recommendations, and lets your team query operational data through conversation.
AI-Powered Anomaly Detection
The platform flags unusual patterns automatically: sudden spikes in exception rates, vendors with changing payment behavior, invoices that deviate from historical norms. You investigate what matters, not everything.
Example
"Invoice volume from Vendor X increased 340% this week with no corresponding PO activity."Actionable Recommendations
Beyond showing metrics, OAN surfaces specific actions. When DSO trends upward, the system identifies which customers are driving the change and which collection actions have the highest recovery probability.
Example
"3 customers account for 68% of the DSO increase. Prioritized outreach list generated."Natural Language Queries
Ask questions in plain language. "What was our touchless invoice rate last quarter?" or "Which vendors have the highest exception rates?" The system translates your question into the right report.
Example
"Show me all invoices over $50K that required manual coding this month."Predictive Insights
Pattern recognition across historical transaction data surfaces trends before they become problems. Forecast month-end close timelines, predict cash application volumes, and anticipate exception spikes.
Example
"Based on current volume, month-end close is tracking 1.5 days ahead of last quarter."The Analytics Platform
Pre-built KPIs, real-time data, configurable views. Everything your team needs to monitor and optimize back-office operations, integrated directly into the OAN platform.
Pre-Built KPI Modules
30+ analytics across AP, AR, Collections, Vendor Management, and Sales Orders. Ready to use on day one, no configuration required.
Real-Time Dashboards
Monitor operational metrics as transactions flow through the system. No batch processing delays or end-of-month waiting.
Drill-Down Reporting
Start at the summary, drill to the root cause. Every metric links back to the underlying transaction for full traceability.
Customizable Views
Tailor dashboards by role, department, or entity. A CFO sees close metrics. An AP manager sees exception queues. Each view is purpose-built.
Threshold Alerts
Automated notifications when metrics cross defined thresholds. Know about exceptions, aging spikes, or processing slowdowns before they compound.
Platform Integrated
Analytics draw from live OAN transaction data. No ETL, no data warehouse, no synchronization lag. The dashboard reflects the current state.
Quarterly Business Reviews
Scheduled reviews surface trends, benchmark against prior periods, and identify process improvements backed by actual transaction data.
Benchmarking
Compare your processing metrics against your own historical performance. Track improvement quarter over quarter with clear before-and-after data.
Analytics Across Every Operation
Each OAN product generates operational data. Analytics turns that data into KPIs, trends, and AI-driven recommendations specific to each domain.
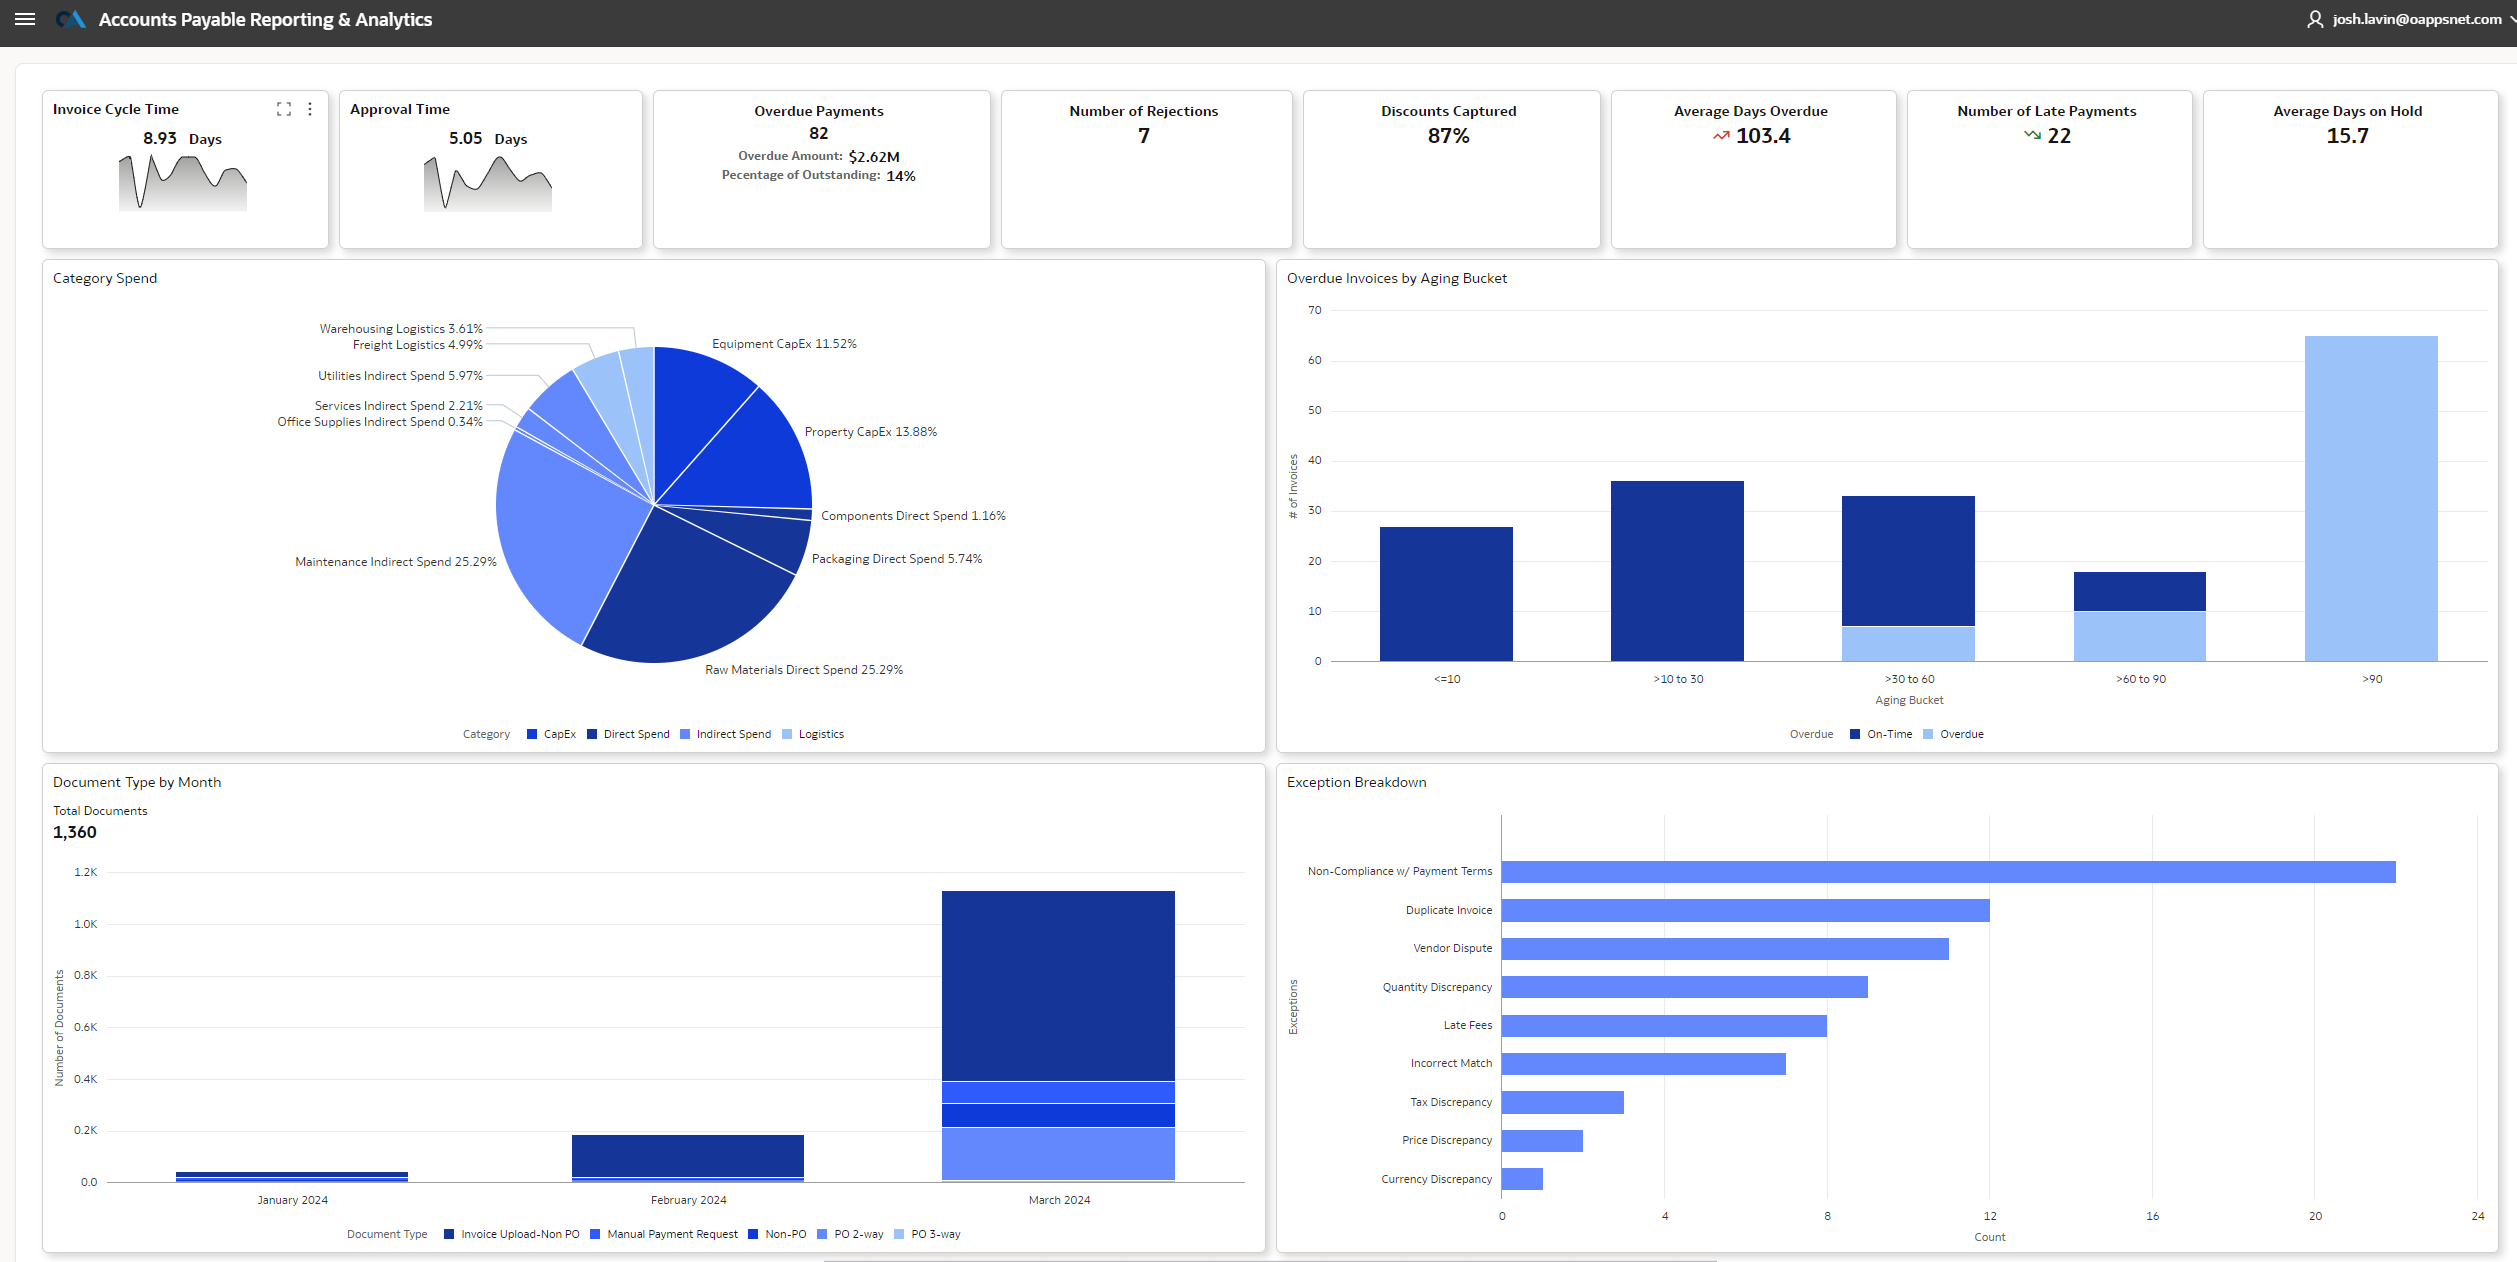
Accounts Payable
Track invoice status and aging, processing efficiency, touchless rates, DPO, discount capture, and first-time accuracy. Identify bottlenecks in approval workflows and measure automation ROI against manual processing baselines.
AI Insight
AI flags invoices that consistently require manual intervention and recommends rule adjustments to increase the touchless rate.
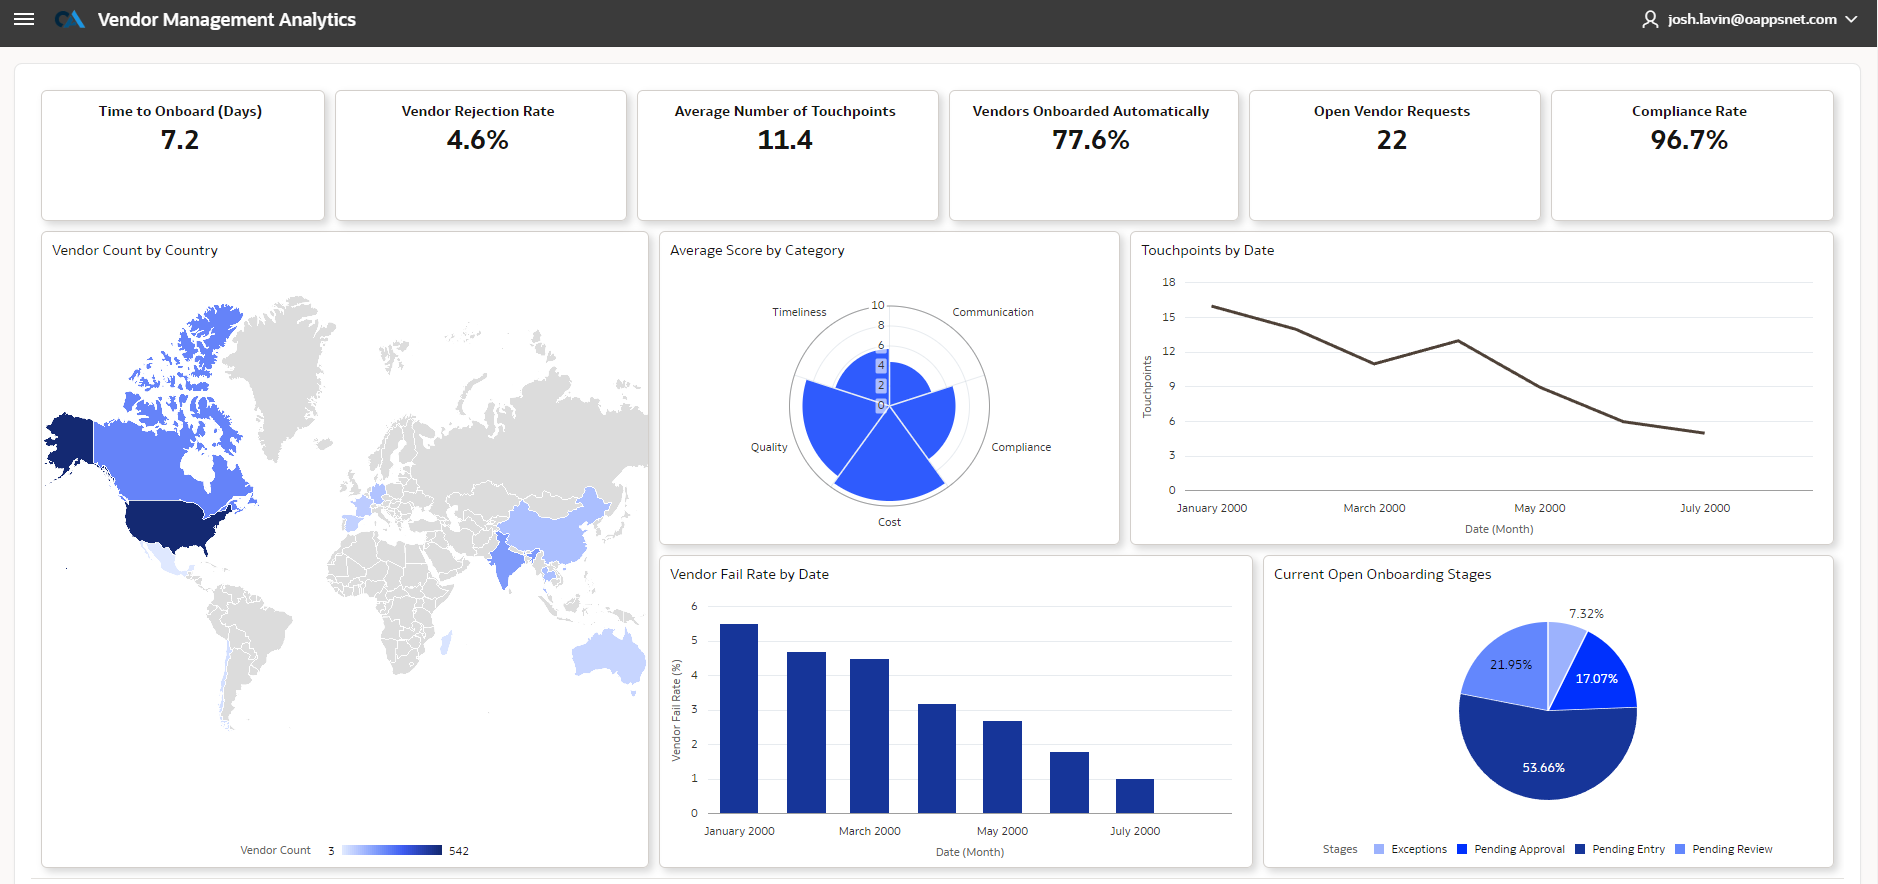
Vendor Management
Measure vendor creation and update cycle times, error rates, approval durations, and data accuracy. Track compliance status across your vendor base and surface suppliers with incomplete or outdated records.
AI Insight
AI identifies vendors with incomplete compliance documentation and prioritizes remediation by risk exposure.
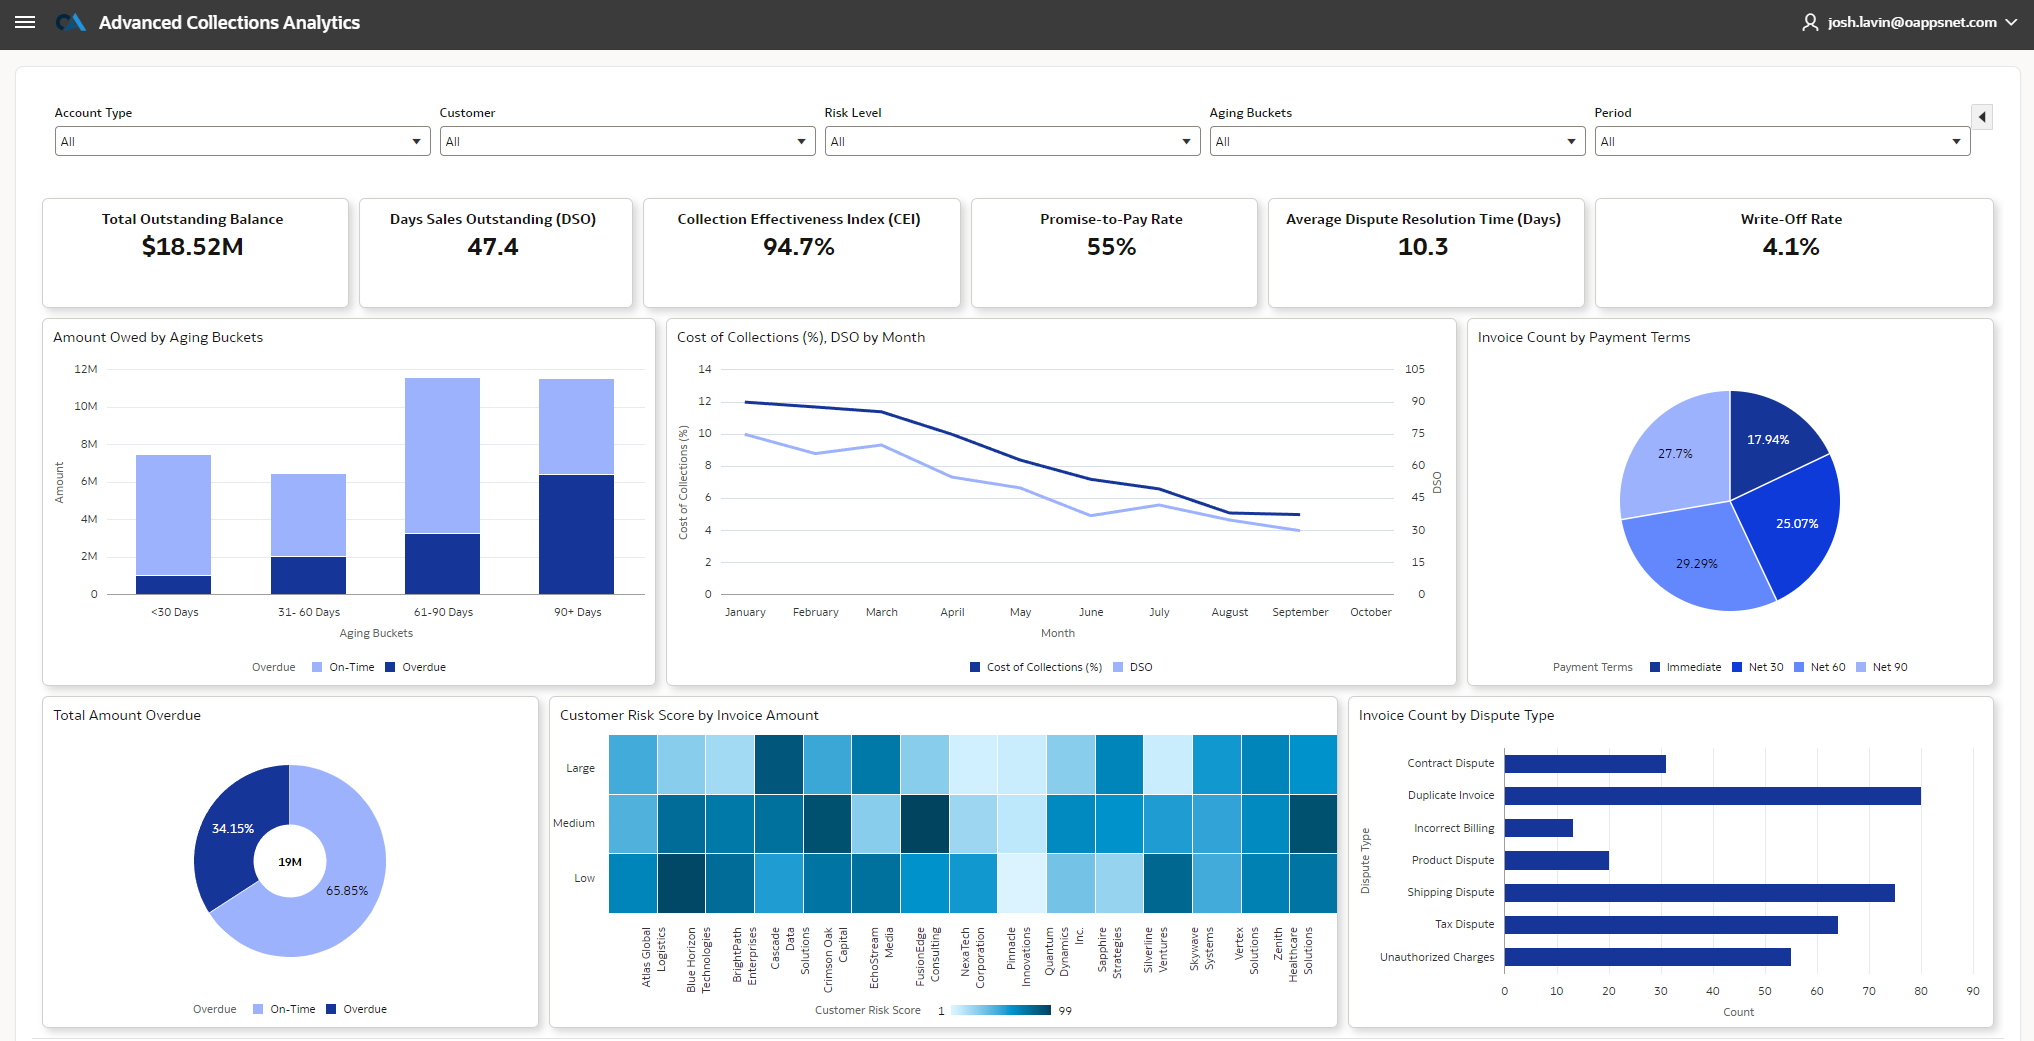
Collections and Cash Application
Monitor Days Sales Outstanding, Collection Effectiveness Index, aging distribution, bad debt write-offs, and promise-to-pay conversion rates. Analyze payment patterns by customer segment to prioritize collection efforts where they have the highest impact.
AI Insight
AI ranks overdue accounts by recovery probability and recommends collection timing based on each customer's historical payment behavior.
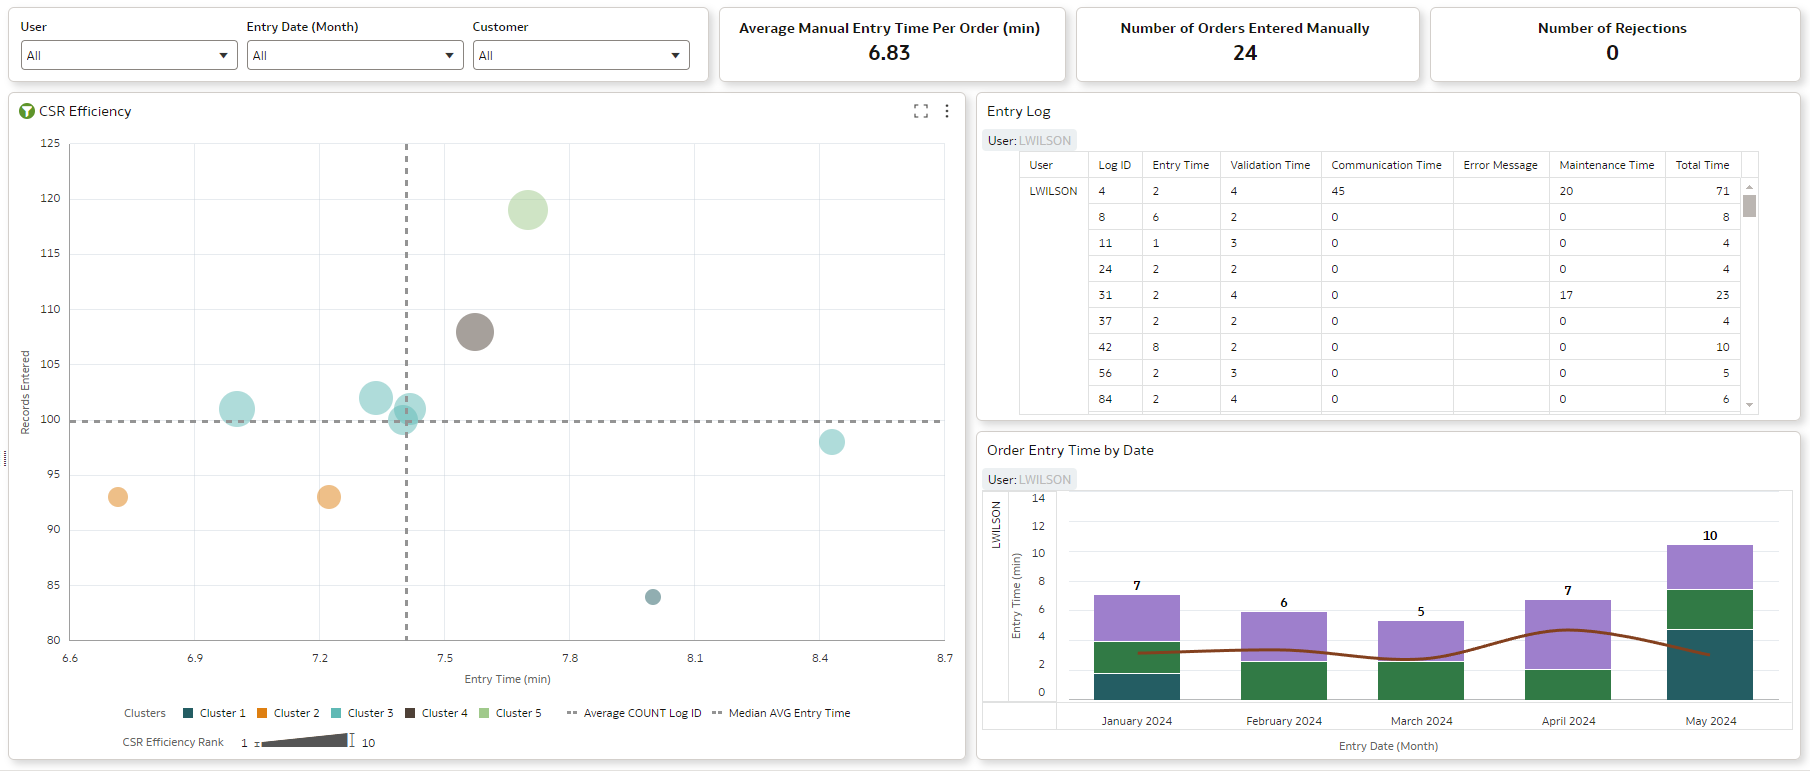
Sales Order Processing
Evaluate order processing time, accuracy rate, cost per order, and automation adoption. Compare automated versus manual order volumes to measure efficiency gains. Track exception handling patterns and fulfillment timelines.
AI Insight
AI identifies recurring order entry errors by customer or channel and suggests validation rule updates to prevent them.
Stop Reading Reports. Start Getting Answers.
See how OAN Operational Analytics gives your team real-time visibility, AI-driven recommendations, and natural language access to your operational data.
Frequently Asked Questions
Analytics provides pre-built KPI modules across AP Invoice Automation, Cash Application, Collections, Vendor Management, and Sales Order Processing. Each module includes domain-specific metrics that activate automatically when the corresponding product is deployed.
The AI layer runs on Oracle Cloud Infrastructure, leveraging Oracle Database 26ai for in-database processing and OCI Generative AI for natural language capabilities. It analyzes transaction patterns, detects anomalies, and surfaces recommendations based on your historical operational data.
Yes. The natural language query interface lets any team member ask questions like "What was our exception rate last month?" or "Which vendors have the slowest onboarding time?" The system translates the question into the appropriate data query and returns the answer.
No. OAN Analytics reads directly from live transaction data within the platform. There is no ETL process, no data warehouse to maintain, and no separate BI tool required. For organizations that want to combine OAN data with other sources, REST APIs are available for export.
Yes. Pre-built modules get you started on day one, but every dashboard, metric, and threshold can be tailored to your organizational structure, role requirements, and reporting preferences.
Dashboards can be configured at the entity, region, or consolidated level. A plant manager sees their facility. A divisional controller sees their business unit. The CFO sees the entire organization. Each view uses the same underlying data with appropriate access controls.
Real-time. Dashboards reflect current transaction state as data flows through the OAN platform. There is no overnight batch process or data refresh delay.